- Home
- Examples
- Download
- User Guide
- Introduction
- Usage as a Library
2.1 Example: Animated Chart
2.2 Example: Lorenz Attractor
2.3 Example: Brusselator
2.4 Example: Zooming
2.5 Example: Off-Screen Image Creation
- Configuration Concept
- JCCKit's PlotApplet
- Extending JCCKit
- API documentation
- SourceForge project page
2.2 Example: Lorenz Attractor
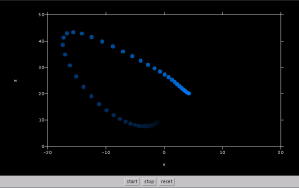
The applet Lorenz (see the Examples page) shows trajectories of the famous Lorenz equations in an animated way. It is an example of the usage of point-to-point hints (see Chapter 1.3 Curves, Points, and Hints).

The overridden applet method init() is similar as in the
example AnimatedChart
(click here to see the complete code):
public class Lorenz extends Applet {
  private double[] _x = new double[3];
  private double[][] _walk = new double[50][2];
  private int _walkIndex;
  private DataPlot _dataPlot;
  private Thread _animationThread;

  public void init() {
    GraphicsPlotCanvas plotCanvas
        = createPlotCanvas("true".equals(getParameter("graphics2D")));

    _dataPlot = new DataPlot();
    _dataPlot.addElement(new DataCurve(""));
    reset();
    plotCanvas.connect(_dataPlot);

    setLayout(new BorderLayout());
    add(plotCanvas.getGraphicsCanvas(), BorderLayout.CENTER);
    add(createControlPanel(), BorderLayout.SOUTH);
  }

  private GraphicsPlotCanvas createPlotCanvas(boolean graphics2D) { ... }

  private Panel createControlPanel() { ... }

  private void reset() { ... }
}
Highlighted code uses JCCKit.
First, createPlotCanvas() creates a GraphicsPlotCanvas (or a Graphics2DPlotCanvas depending on the applet parameter named graphics2D). Next, a DataPlot object with an empty DataCurve is created. The method reset() replaces the empty curve by an initial curve with 50 identical points. After the DataPlot has been connected to the PlotCanvas the applet panel will be filled with the view of the PlotCanvas and the control panel with the buttons.
The state of the Lorenz equation is stored in the array _x. The array _walk holds two variables from the current state as well as from the 49 previous states. The _walkIndex points onto the current state inside _walk.
Here is the code for configuration and creation of the
PlotCanvas:
private GraphicsPlotCanvas createPlotCanvas(boolean graphics2D) {
  Properties props = new Properties();
  ConfigParameters config = new ConfigParameters(new PropertiesBasedConfigData(props));
  props.put("foreground", "0xffffff");
  props.put("background", "0");
  props.put("plot/legendVisible", "false");
  props.put("plot/coordinateSystem/xAxis/minimum", "-20");
  props.put("plot/coordinateSystem/xAxis/maximum", "20");
  props.put("plot/coordinateSystem/xAxis/ticLabelFormat", "%d");
  props.put("plot/coordinateSystem/yAxis/axisLabel", "z");
  props.put("plot/coordinateSystem/yAxis/minimum", "0");
  props.put("plot/coordinateSystem/yAxis/maximum", "50");
  props.put("plot/coordinateSystem/yAxis/ticLabelFormat", "%d");
  props.put("plot/curveFactory/definitions", "curve");
  props.put("plot/curveFactory/curve/initialHintForNextPoint/className",
            "jcckit.plot.ShapeAttributesHint");
  props.put("plot/curveFactory/curve/initialHintForNextPoint/initialAttributes/fillColor",
            "0x50a");
  props.put("plot/curveFactory/curve/initialHintForNextPoint/fillColorHSBIncrement",
            "0.0 0.0 0.018");
  props.put("plot/curveFactory/curve/withLine", "false");
  props.put("plot/curveFactory/curve/symbolFactory/className",
            "jcckit.plot.CircleSymbolFactory");
  props.put("plot/curveFactory/curve/symbolFactory/size", "0.015");

  return graphics2D ? new Graphics2DPlotCanvas(config) : new GraphicsPlotCanvas(config);
}
The animation is started after the start button has been hit. It runs inside
the _animationThread which calls next():
private void next() {
  integrate();
  _walk[_walkIndex][0] = _x[0];
  _walk[_walkIndex][1] = _x[2];
  _walkIndex = (_walkIndex + 1) % _walk.length;
  updateCurve();
}

private void integrate() { ... }

private void updateCurve() {
  DataCurve curve = new DataCurve("trajectory");
  for (int i = 0; i < _walk.length; i++) {
    int index = (_walkIndex + i) % _walk.length;
    curve.addElement(new DataPoint(_walk[index][0], _walk[index][1]));
  }
  _dataPlot.replaceElementAt(0, curve);
}
The method integrate() calculates the state for the next time step.
We are not going into the details of the numerical integration of the
differential equations. x and z of the state will be stored
in _walk at the _walkIndex. After a cyclical increment of
_walkIndex the curve will be updated.
First, a new DataCurve instance is created which will be filled with
all points from _walk. Then, the old curve will be replaced by the
new one. Behind the scene, the view will be automatically updated.
(C) 2003-2004 Franz-Josef Elmer. All rights reserved. Last modified: 5/2/2003